

The rise of Artificial Intelligence (AI) presents both unprecedented opportunities and novel challenges for product development. We stand at the cusp of a technological revolution, where AI-driven tools are poised to redefine user experiences across industries. However, the true potential of AI can only be realized if we adopt a rigorous, human-centered approach to measurement. As product leaders, UX designers, and developers, we must move beyond simply deploying AI and delve into understanding its impact on users and business goals. This necessitates a shift towards defining and tracking key metrics that provide actionable insights, guide iterative improvements, and ensure responsible AI development.
This article delves into the essential categories of AI metrics, offering a comprehensive framework for evaluating the success of AI-powered products. By understanding and applying these metrics, we can cultivate AI solutions that are not only technologically advanced but also user-centric, valuable, and sustainable.
The Foundation: Why Measurement Matters in the Age of AI
Imagine embarking on a long journey without a map or compass. You might wander aimlessly, unsure of your progress or destination. Similarly, developing AI without a clear measurement strategy can lead to wasted resources, misdirected efforts, and ultimately, a failure to achieve desired outcomes.
Metrics serve as our navigational tools in the complex landscape of AI product development. They provide:
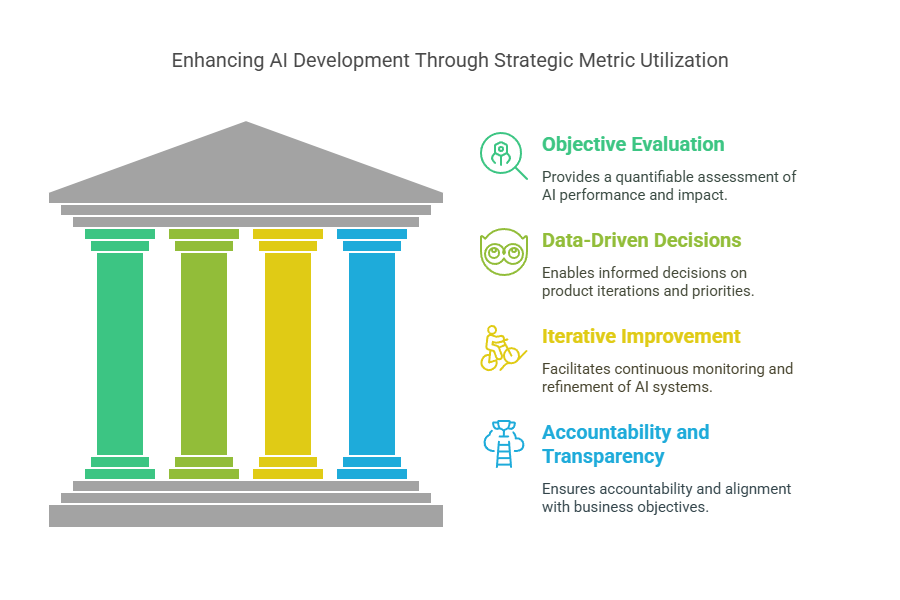
- Objective Evaluation: Metrics offer a quantifiable way to assess AI performance, user engagement, and business impact, moving beyond subjective opinions and gut feelings.
- Data-Driven Decisions: By tracking relevant metrics, we can identify areas of strength and weakness, make informed decisions about product iterations, and prioritize development efforts.
- Iterative Improvement: Metrics enable us to monitor the effects of changes and optimizations, fostering a cycle of continuous improvement and refinement.
- Accountability and Transparency: Defining clear metrics promotes accountability within development teams and enhances transparency with stakeholders, ensuring that AI initiatives are aligned with overall business objectives.
- Ethical Considerations: Metrics can also play a crucial role in identifying and mitigating potential biases or unintended consequences of AI systems, promoting responsible AI development.
The Pillars of AI Measurement: Key Metric Categories
To effectively evaluate AI-driven products, we must consider a range of metrics that span across several key categories:
1. User Engagement: Measuring the Quality of Interaction
User engagement metrics provide insights into how users interact with AI features and the value they derive from those interactions. These metrics are crucial for understanding user behavior, identifying areas for improvement, and optimizing the overall user experience.
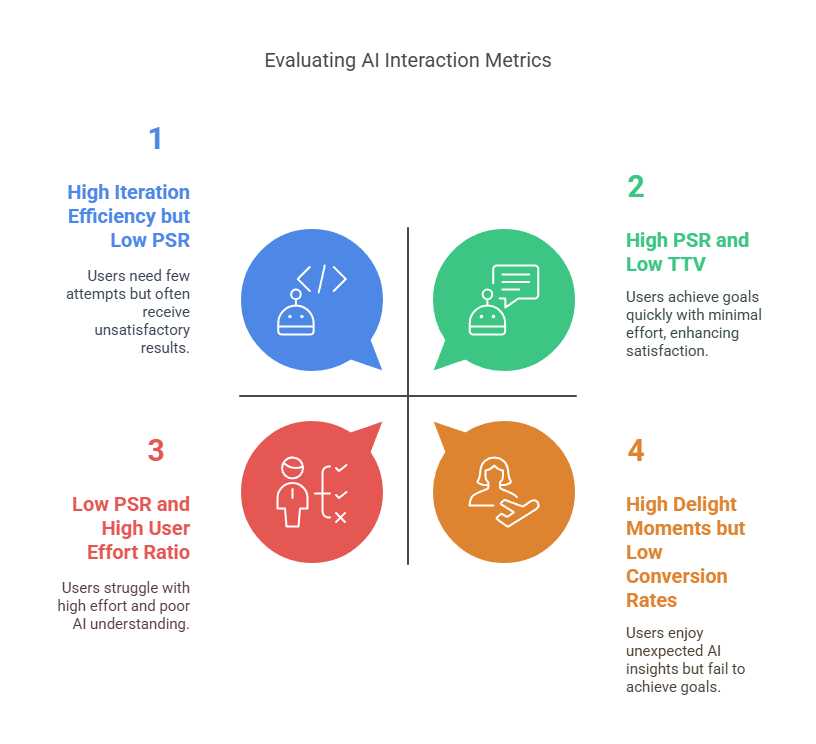
- Prompt Success Rate (PSR): In many AI applications, users initiate interactions through prompts or queries. PSR measures the percentage of these prompts that yield a satisfactory result on the first attempt. A high PSR indicates that the AI is effectively understanding user intent and providing relevant responses, leading to a more efficient and satisfying user experience. Conversely, a low PSR may signal issues with the AI's natural language processing capabilities, its knowledge base, or the clarity of user prompts.
- Example: In a customer service chatbot, a high PSR would mean that customers frequently get their questions answered correctly in their initial interaction, reducing frustration and the need for escalation to a human agent.
- Iteration Efficiency: This metric tracks the number of attempts or interactions a user needs to have with the AI to achieve their desired outcome. High iteration efficiency implies a smooth and intuitive user experience, where users can quickly and easily accomplish their goals. Low iteration efficiency, on the other hand, suggests that users are struggling to communicate effectively with the AI or that the AI is providing incomplete or inaccurate information.
- Example: In a code generation tool, iteration efficiency would measure how many times a developer needs to refine their prompts or adjust the AI's output to generate the desired code snippet.
- Time-to-Value (TTV): TTV measures the time it takes for users to realize the core benefit or achieve their goals using the AI tool. In today's fast-paced digital landscape, users expect immediate value and quick results. A short TTV is essential for driving user adoption, increasing engagement, and fostering a sense of accomplishment. Conversely, a long TTV can lead to user frustration, abandonment, and a perception that the AI is inefficient or cumbersome.
- Example: In a meeting summarization tool, TTV would measure how quickly a user can obtain a concise and accurate summary of a meeting, enabling them to save time and quickly grasp key information.
- User Effort Ratio: This metric compares the amount of effort users expend to the value they receive from the AI's output. It's a measure of the "return on investment" from the user's perspective. An optimal user effort ratio indicates that the AI is providing significant value while requiring minimal user input or cognitive load. A high user effort ratio suggests that users are working too hard to get results, leading to dissatisfaction and decreased adoption.
- Example: In an image editing tool, the user effort ratio would compare the time and steps required by the user to achieve a specific edit using AI versus traditional manual editing techniques.
- Delight Moments: These are instances where the AI pleasantly surprises users, exceeds their expectations, or provides unexpected value. Delight moments are crucial for building emotional connections with users, fostering loyalty, and creating a positive perception of the AI. They can arise from the AI's creativity, its ability to anticipate user needs, or its capacity to provide personalized and relevant experiences.
- Example: An AI travel assistant that proactively suggests hidden gems or personalized itineraries based on user preferences can create delight moments and enhance the overall travel experience.
- Clicks on AI Features: This metric tracks user interaction with specific AI-driven elements within the product. It provides valuable insights into which AI features are being used most frequently, which features are being ignored, and how users are navigating the AI interface. This data can inform design decisions, guide feature prioritization, and help optimize the user experience.
- Time Spent with AI Features: This metric measures the duration of user interaction with AI elements. It indicates the level of user engagement and the depth of interaction. Longer time spent with AI features may suggest that users are finding the AI valuable and are actively exploring its capabilities. Conversely, short interaction times may indicate that users are struggling to find what they need or that the AI is not providing sufficient value.
- Conversion Rates with AI Features: This metric tracks the completion of desired actions after users interact with AI features. It directly links AI usage to business outcomes, demonstrating the AI's effectiveness in driving user behavior and achieving specific goals.
- Example: In an e-commerce platform, this could measure how often AI-powered product recommendations lead to successful purchases.
2. User Satisfaction: Gauging User Sentiment and Perception
User satisfaction metrics focus on capturing user sentiment, opinions, and overall satisfaction with the AI experience. These metrics are essential for understanding user needs, identifying areas of dissatisfaction, and ensuring that the AI is meeting user expectations.
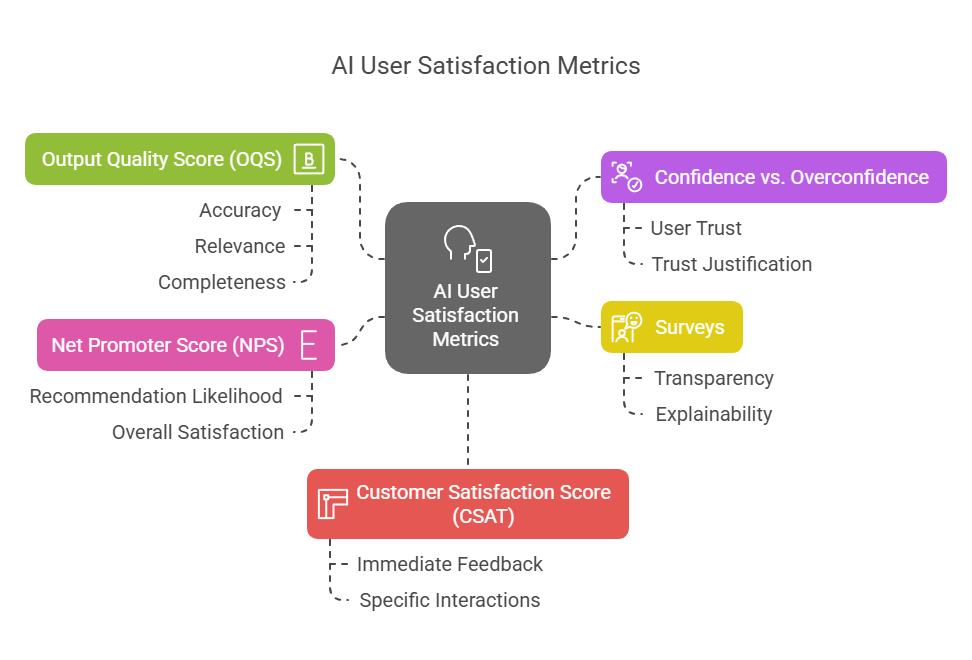
- Output Quality Score (OQS): This metric assesses the quality of the AI-generated output, evaluating its accuracy, relevance, completeness, and overall usefulness. OQS can be measured through various methods, including user ratings, expert evaluations, or automated quality checks. A high OQS indicates that the AI is providing high-quality results that meet user needs, while a low OQS suggests that the AI's output may be inaccurate, irrelevant, or poorly presented.
- Example: In a writing assistant, OQS could assess the grammar, clarity, and coherence of the AI-generated text.
- Confidence vs. Overconfidence: This metric monitors user trust in the AI's output and the appropriateness of that trust. It's crucial to understand not only whether users trust the AI, but also whether that trust is justified. Overconfidence in an AI system can lead to dangerous situations, where users rely too heavily on potentially flawed or biased information.
- Example: In a medical diagnosis AI, it's vital to measure if doctors are appropriately weighing the AI's suggestions against their own expertise.
- Surveys (AI-Specific): Surveys provide a direct channel for gathering user feedback on specific AI functionalities, features, or interactions. They can be used to assess user satisfaction, identify pain points, and gather suggestions for improvement. AI-specific surveys should be tailored to address the unique aspects of AI interactions, such as transparency, explainability, and perceived reliability.
- Net Promoter Score (NPS): NPS measures the likelihood of users recommending the product or service to others based on their AI experience. It's a valuable indicator of overall user satisfaction and loyalty. A high NPS suggests that users are highly satisfied with the AI and are enthusiastic about sharing their positive experiences, while a low NPS indicates that users are dissatisfied and may even discourage others from using the product.
- Customer Satisfaction Score (CSAT): CSAT directly measures user satisfaction with specific AI interactions or touchpoints. It's typically measured through short surveys or feedback forms immediately following an AI interaction, providing a snapshot of user sentiment in the moment.
3. System Quality: Ensuring Reliability and Performance
System quality metrics focus on evaluating the technical performance, reliability, and efficiency of the AI system. These metrics are crucial for ensuring that the AI is functioning optimally, providing a seamless user experience, and meeting performance expectations.
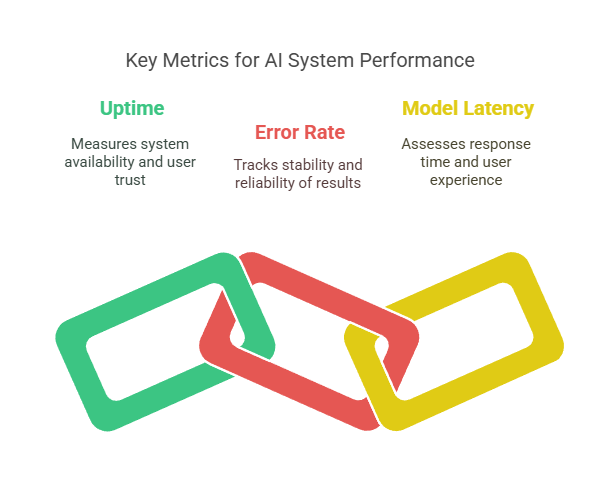
- Uptime: This metric measures the percentage of time the AI system is operational and available to users. High uptime is essential for maintaining user trust and ensuring that the AI is accessible whenever needed. Downtime can lead to user frustration, lost productivity, and damage to the product's reputation.
- Error Rate: This metric tracks the percentage of requests or interactions that result in errors or failures. A low error rate indicates that the AI system is stable and reliable, providing consistent and accurate results. High error rates can signal underlying issues with the AI's algorithms, infrastructure, or data quality.
- Model Latency: This metric measures the time it takes for the AI model to process a user request and generate a response. Low latency is crucial for providing a responsive and engaging user experience. Delays in AI responses can lead to user frustration, perceived slowness, and a negative impact on overall satisfaction.
- Example: In a real-time translation app, low latency is critical for enabling seamless communication between users speaking different languages.
4. Adoption & Usage: Measuring User Uptake and Engagement Patterns
Adoption and usage metrics provide insights into how users are adopting AI features, how frequently they are using them, and how deeply they are engaging with the AI system. These metrics are essential for understanding user behavior, identifying adoption barriers, and optimizing the AI for increased usage.
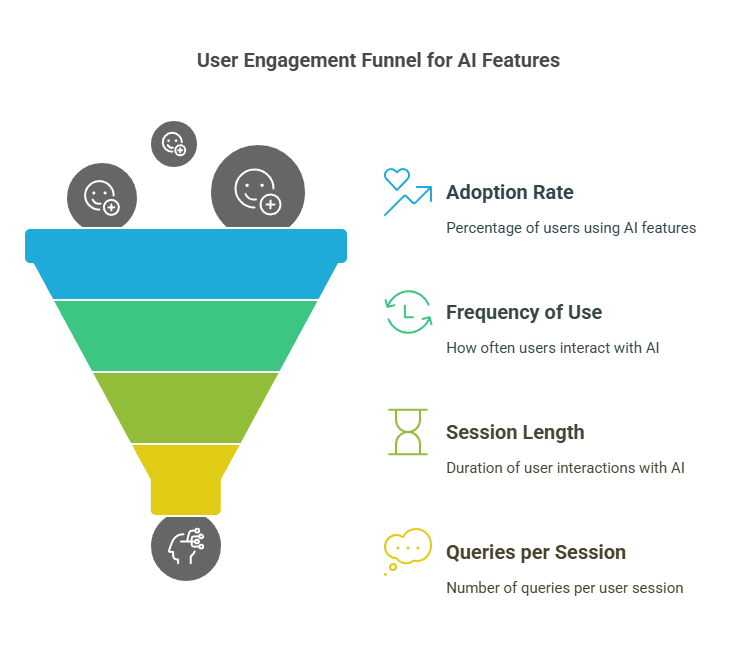
- Adoption Rate: This metric tracks the percentage of active users who are using a new AI feature or tool. It measures the success of the AI's launch and the initial user uptake. A high adoption rate indicates that users are finding the AI valuable and are readily incorporating it into their workflows. A low adoption rate may suggest that the AI is not meeting user needs, that it is poorly promoted, or that there are barriers to adoption.
- Frequency of Use: This metric measures how often users interact with the AI model. It indicates the level of user engagement and the AI's stickiness. Frequent use suggests that the AI is providing ongoing value and is becoming an integral part of the user's routine. Infrequent use may indicate that the AI is not sufficiently useful or that users are forgetting about its existence.
- Session Length / Queries per Session: These metrics measure the average duration of user interaction with the AI and the number of queries or requests users make per session. They provide insights into the depth of user engagement and the complexity of user interactions. Longer session lengths and more queries per session may suggest that users are actively exploring the AI's capabilities and using it for complex tasks.
5. Business Value: Demonstrating ROI and Impact
Business value metrics focus on measuring the impact of AI on business outcomes, such as productivity, cost savings, and customer experience. These metrics are essential for demonstrating the ROI of AI initiatives and justifying investments in AI development.
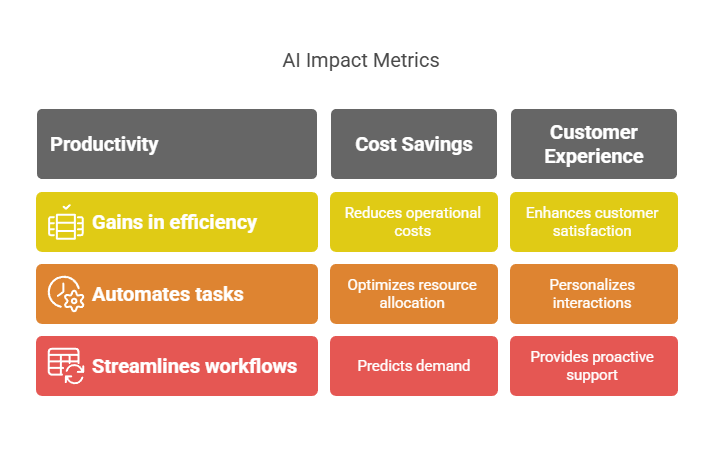
- Productivity Value: This metric captures the improvements in productivity enabled by AI, such as increased efficiency, reduced task completion time, or enhanced output. AI can automate tasks, streamline workflows, and provide users with valuable insights, leading to significant productivity gains.
- Example: In a project management tool, AI could automate task assignments and progress tracking, freeing up project managers to focus on more strategic activities.
- Cost Savings: This metric illustrates the efficiencies gained and cost reductions achieved through AI applications, such as reduced labor costs, optimized resource allocation, or decreased operational expenses. AI can automate repetitive tasks, optimize processes, and predict demand, leading to significant cost savings for businesses.
- Example: AI-powered chatbots can handle a large volume of customer inquiries, reducing the need for human agents and lowering customer support costs.
- Customer Experience Impact: This metric measures the impact of AI on customer satisfaction, loyalty, and overall customer experience. AI can personalize interactions, provide proactive support, and enhance customer service, leading to increased customer satisfaction and loyalty.
- Example: AI-driven recommendation systems can provide personalized product suggestions, enhancing the shopping experience and increasing sales.
A Humanistic Approach to AI Metrics: Beyond the Numbers
While quantitative metrics are essential for evaluating AI, it's crucial to remember that AI is ultimately designed to serve humans. Therefore, a humanistic approach to AI metrics is paramount. This means:
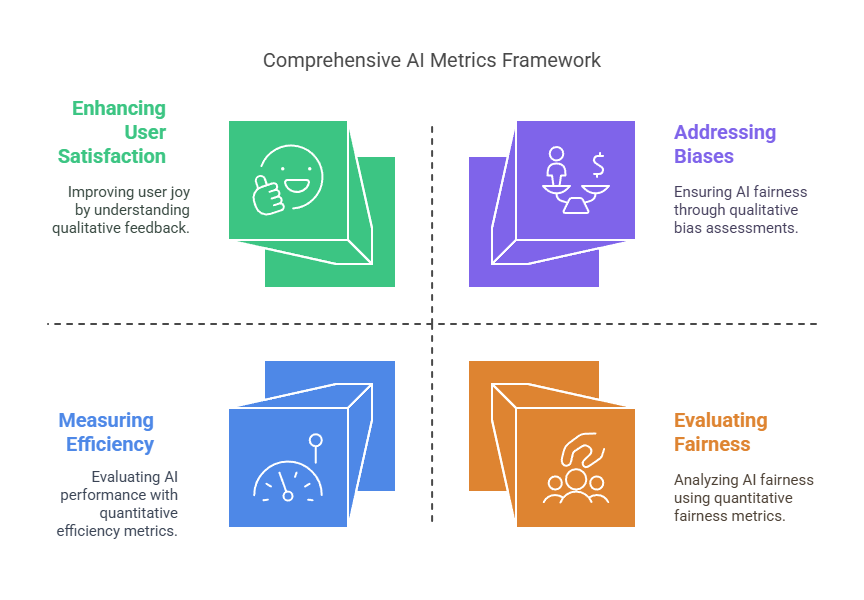
- Focusing on User Needs: Metrics should be aligned with user needs, goals, and pain points. We should prioritize metrics that reflect the value AI is providing to users and how it is improving their lives.
- Emphasizing User Experience: Metrics should capture the quality of the user experience, including usability, accessibility, and emotional response. We should strive to create AI that is not only efficient but also enjoyable and satisfying to use.
- Considering Ethical Implications: Metrics should be used to identify and mitigate potential biases, fairness issues, and ethical concerns related to AI. We should ensure that AI is developed and deployed responsibly, with a focus on human well-being and societal impact.
- Combining Quantitative and Qualitative Data: Metrics should be complemented by qualitative data, such as user feedback, interviews, and observations. This provides a richer understanding of user experiences and helps to interpret quantitative data in context.
Conclusion: Charting a Course for Responsible and Impactful AI
Measuring AI is not merely a technical exercise; it's a fundamental responsibility. By embracing a comprehensive and human-centered approach to AI metrics, we can navigate the complexities of AI development, ensure its responsible deployment, and unlock its transformative potential to create a better future for all. As we continue to push the boundaries of AI, let us remember that the ultimate measure of its success lies in its ability to enhance human lives, empower individuals, and contribute to the greater good.


